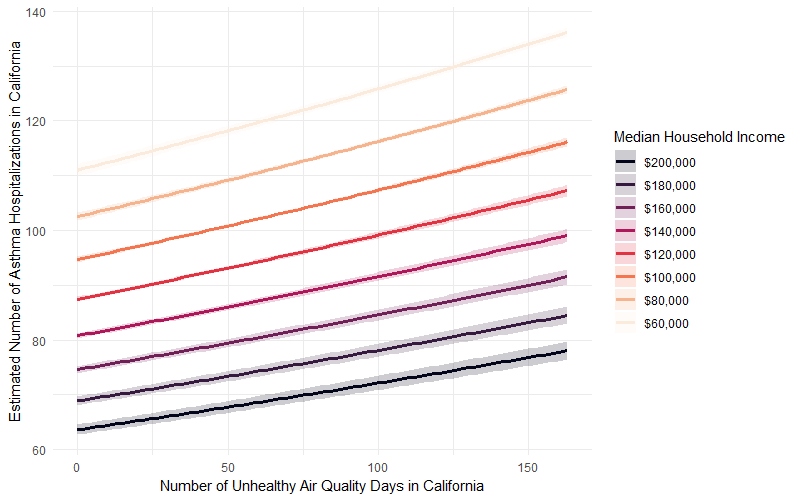
Did you know that areas with a higher number of unhealthy air quality days in California were associated with a higher number of asthma hospitalizations? Poorer areas experienced a much greater increase in asthma hospitalizations than richer areas in response to bad air quality.
Poisson regression model estimating total asthma hospitalizations in counties in California using number of air quality days labeled as unhealthy/very unhealthy/hazardous as the main predictor and median household income as a covariate with population as an offset. The model includes 95% confidence intervals. Asthma and air quality data by county are from 2015 to 2023. Median household income and population by county data are from 2023.
Data source: Model created using population counts and median household income data for California from US Census. Asthma hospitalization rates by county data are from California Department of Public Health. Air quality index data are from the US EPA.
*These figures have not yet been formally peer reviewed and are intended as exploratory