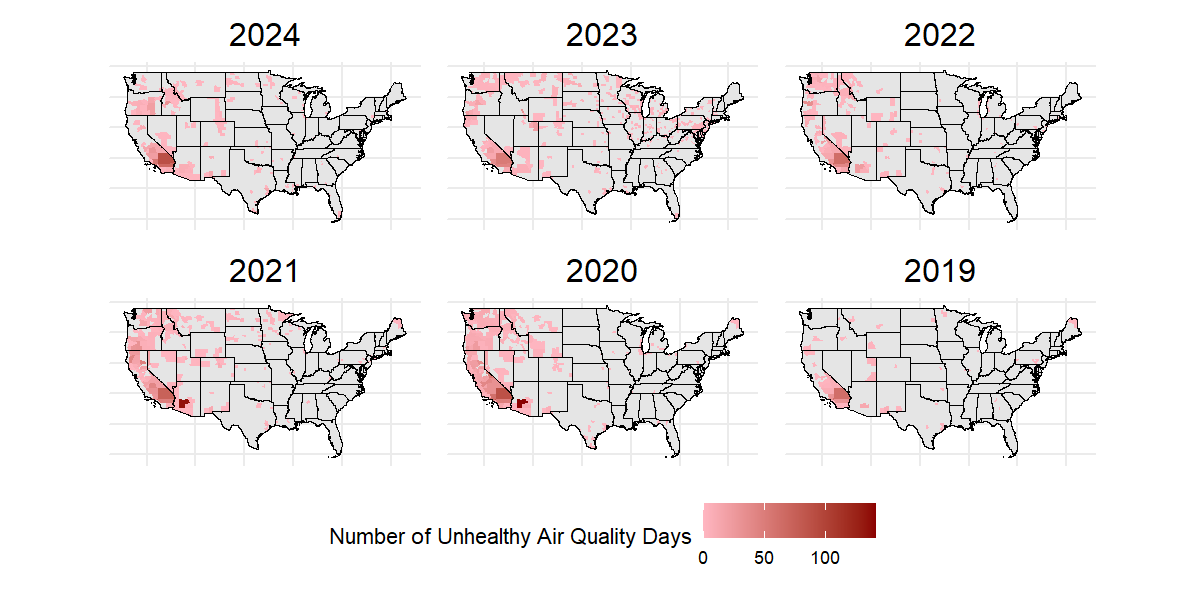
Did you know many counties in the U.S. especially those in the southwest experience hundreds of days each year with unhealthy air? The areas and years with more unhealthy air quality days also happen to have more wildfires (we’ll learn more about wildfires tomorrow!)
These maps show the number of days in each county with air quality in the categories Unhealthy; Very Unhealthy; or Hazardous. Counties with missing data appear in gray.
Data source: Created using data of Air Quality Index from U.S. EPA from 2019 to 2024.
*These figures have not yet been formally peer reviewed and are intended as exploratory